Tropical Cyclones in Atmospheric Models (CLIVAR-Hurricane-WG)
Hurricanes in high resolution AGCM
Homepage
Hurricanes in AGCM
Animations
CLIVAR Hurricane WG EXP.
Climatological Experiments
Inter-annual Experiments
Web Contact: Ming Zhao
Site created with Cheetah.
Last updated: Jun 30 2011
Hurricanes in high resolution AGCM by M. Zhao, K. Oouchi, S. Schubert and W. Putman
Motivations and present-day simulations
What controls the global number and distribution of hurricanes/typhoons and tropical cyclones (TC)? How might these change with changing climate? The large range of spatial and temporary scales associated with the physical and dynamical processes of TC/hurricane genesis makes simple theories difficult. Recent studies using high resolution global climate models (GCM) offer a promising approach towards answering these questions (Sugi et. al 2002, McDonald et. al 2005, Yoshimura et. al 2006, Oouchi et. al 2006, Chauvin et. al 2006, Bengtsson et. al 2007a,b, LaRow et. al 2008, Zhao et. al 2009, Sugi et. al 2009, Zhao and Held 2010, Held and Zhao 2011). See Knutson et. al (2010) for a recent review. Despite still relatively coarse spatial resolution (20-100km), these new GCMs permit a direct simulation of the generation of TC-like vortices with tropical storm and hurricane strength. Most of the current TC-permitting GCM simulations use prescribed sea surface temperature (SST), which do not allow ocean response and feedback to TCs/hurricanes. Nevertheless, when forced by observed SST distribution these models did demonstrate their ability in reproducing many features of TC/hurricane frequency variability for the past few decades during which reliable observational data are available. These include the global geographical distribution, seasonal cycle, interannual variability as well as decadal trend of storm frequency for multiple ocean basins. Below shows an example of the simulations from the GFDL HIRAM (Zhao et. al 2009).
Figure 1. A comparison of geographical distribution of observed (upper panel) and model simulated (lower panel) hurricane tracks from 1981 to 2005 . |
Figure 2. Observed and model simulated seasonal cycle (number of hurricanes per month) for each ocean basin from the 4-member ensemble mean. |
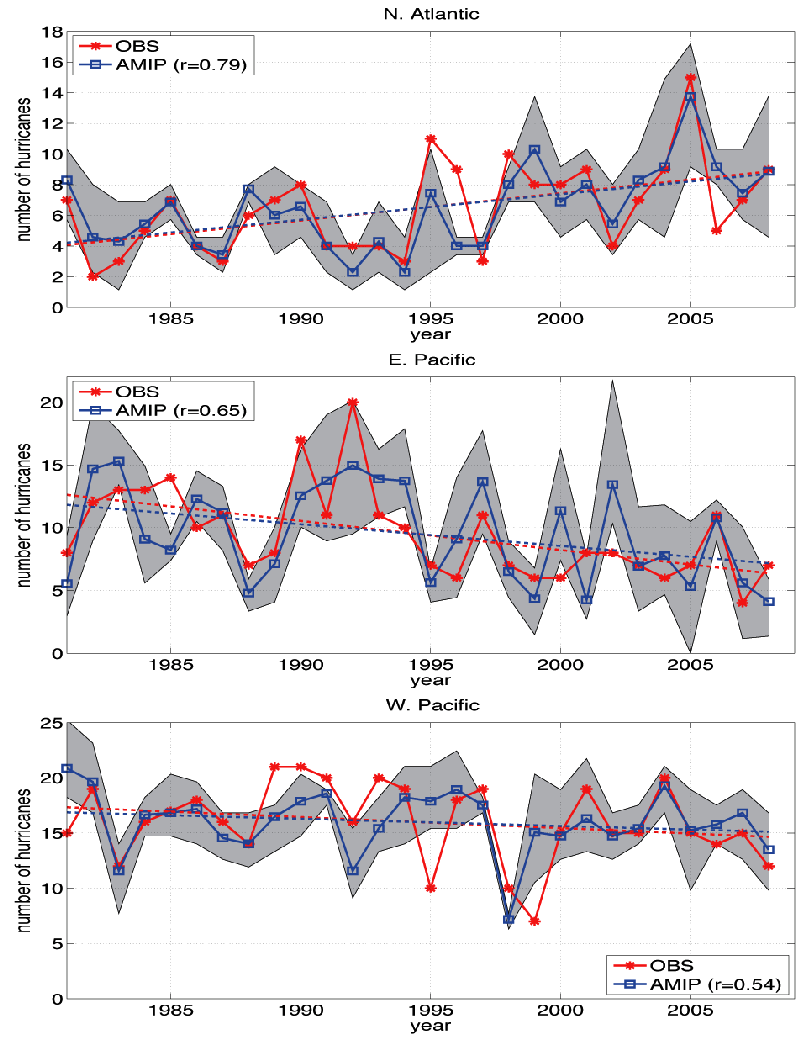
Figure 3. Interannual variation of hurricane count. Red: observations; blue: model ensemble mean; Model time series are normalized. Dotted lines show linear trends. |


Hurricane frequency response to global warming
The quality of the present-day simulations has motivated the studies of TC/hurricane responses to global warming. Most of the GCM studies in literature utilized a time slice method in which SST warming anomalies derived from lower resolution coupled climate models are used as the lower boundary conditions for a global high resolution atmospheric model. Below displays an example of the simulations based on the GFDL HIRAM (Zhao et. al 2009, Zhao and Held 2011).
Figure 4. Fractional changes in annual hurricane count for a) N. Atlantic, b) E. Pacific, c) W. Pacific, d) N. Indian, e) S. Indian, and f) S. Pacific from 10 SST warming experiments [1-8: 8 individual CMIP3 model projected SST warming anomalies; 0: 18-model ensemble mean SST anomaly; 9: uniform 2K warming] and the control experiment. Error bars show the 90% confidence interval; legend shows the standard deviation of fractional changes across the models. |
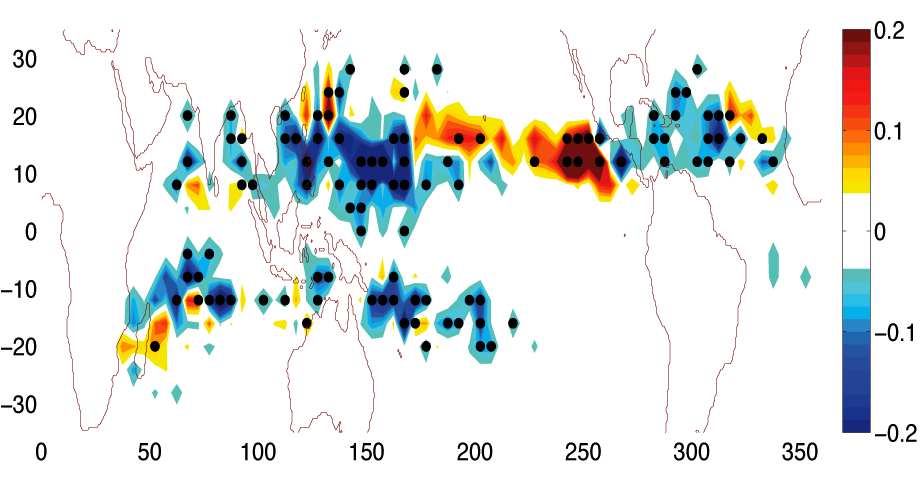
Figure 5. Geographical distribution of the changes in annual hurricane genesis frequency averaged from the 8 global warming experiments [unit: number/year per 4x5 (latxlon) degree]. Stippled area denote grid boxes where at least 6 out of the 8 (75%) models agree on the sign of change. |

Implications, issues and future work through collaborated research
Despite recent progress on high resolution AGCM modeling of TCs/hurricanes, a number of issues remain that hinder our understanding and our ability to simulate the variability and change in TC/hurricane statistics.- Uncertainties associated with SSTs and other forcings:
For the historical simulations, GFDL HIRAM forced by two different SST analysis product (HadiSST vs. Reynolds) over the 1981-2008 period produce large difference in both TC/hurricane trends and the mean frequency in the North Atlantic. In particular, the observed upward trend are within the uncertainty of the simulations forced by the HadiSST (Rayner et. al 2003) while the simulated trend forced by the Reynolds SST (Reynolds et. al 2002) is much smaller and is not significantly different from 0. For the future projections, there is large inter-model spread in the magnitude and (for some basins) even the sign of the change in hurricane frequency among the different SST projections in each ocean basin. These differences are due entirely to the different SST warming patterns. These results further emphasize the importance in assessing and improving the quality of SST analysis and its projections in global climate models (Vecchi et. al 2008). However, it is unclear if this strong sensitivity of TC/hurricane frequency to SSTs is a robust feature across models. It is also not clear if it is due to the deficiency in models forced by prescribed SSTs which do not allow ocean response and feedback to TCs/hurricanes. - Uncertainties associated with model physics/dynamics:
There are some evidence that the AGCM simulated TC/hurricane climatology and possibly their response to warming may depend to some extent on model details in physics/dynamics. For example, in contrast to the underestimates of W. Pacific storms in Oouchi et. al 2006, the GFDL HIRAM produce an overestimates of W. Pacific storms (Zhao et. al 2009). It is not clear what cause this difference and how it may impact the simulated TC/hurricane response to warming. In literature, however, the differences among simulations often involve simultaneous changes of both models and forcings. For example, Villarini et. al (2011) shows some of the divergence in simulated N. Atlantic storm frequency response among different models for apparently the same SST forcing are in fact due to the differences in SST forcing since they are extracted differently (some use linear trends; some use differencing between the last and the first 20 year period of each simulation). A systematic model inter-comparison under controlled conditions through collaborated research such as that proposed here in US-CLIVAR Hurricane WG would clearly be useful to address these issues. - Limitation of models using prescribed SSTs and the time-slice
method:
Despite many years of application of the prescribed SST method for present-day simulation and time-slice approach for studying the impact of climate change on weather extremes, some studies suggest its limitations for studying regional climate change in certain locations such as the South Asia and the Indian ocean (Douville et. al 2005, Copsey et. al 2006). Future research would be needed to better understand these limitations and implications and develop new methods (e.g., Emanuel et. al 2008, Knutson et. al 2008) for downscaling the effect of climate change on hurricane statistics in some regions. Ultimately, fully-coupled ocean atmospheric models at fine spatial resolution with integrations over centennial scale will provide the most convincing simulations. - Hurricane/TC intensity simulation and model resolution:
Most of the current AGCMs still have resolutions too coarse to simulate the full range of TC intensity distribution. However, TCs at higher intensity categories such as the major hurricanes account for most storm damage. Two approaches have been currently utilized to correcting this deficiency: 1) additional dynamical downscaling (e.g., Bender et. al 2010). 2) statistical refinement (e.g., Zhao and Held 2010). Ultimately, we need move to ultra-fine resolution to fully resolve this issue. Limited ultra-fine resolution model inter-comparison would be useful to establish an adequate resolution for this application. - Uncertainties in TC detection and tracking algorithm
Model simulated TC/hurricane statistics may to some extent be sensitive to details in TC detection and tracking algorithm. This often complicates direct comparisons among the different simulation results in literature. It would be useful to develop a unified TC detection and tracking scheme for the hurricane-climate community.
A new approach -- global non-hydrostatic model
Cyclogenesis associated with intra-seasonal disturbancesAlong with the traditional approach by hydrostatic models, non-hydrostatic model, or global cloud-resolving model (GCRM), has started to set the scene for more accurate simulation and future projection of tropical cyclone. An advantage of GCRM is its capability of resolving hierarchy of meso-scale convection associated with tropical cyclogenesis and intensity variation. An example of case-study of the cyclone "Nargis" is presented here. With NICAM (Non-hydrostatic Icosahedral Atmospheric Model; Satoh et al. 2008; Tomita and Satoh 2004), a prototype GCRM, an ensemble simulation of cyclone Nargis was performed with varying the periods of initialization (Taniguchi et al. 2010). The Nargis made landfall over southern Myanmar on May 2, 2008 with winds in excess of 65 m/s, over 600 mm total rainfall, which led to such a tremendous catastrophe across the Irrawaddy Delta. An observational indicated that Nargis was initiated in the Bay of Bengal by the emergence of an incipient cyclonic disturbance as an emanation from a Rossby wave-induced vortex when the intra-seasonal convective anomaly reached the Maritime Continent (Kikuchi and Wang, 2010). It was found that cyclone Nargis formed immediately after the peak of the MJO signal in the Indian Ocean when the active convective region associated with the MJO passed through the Bay of Bengal and was located mainly over the Maritime continent. The cyclone Nargis developed during the period of northward migration of low-level zonal wind accompanied with the active convective region (Fig. 6). Figure 7 indicates that an ensemble of cloud clusters, a northern branch of the twin disturbances residing across the equator, develops into the tropical cyclone. Without northward migration signaling monsoon onset and almost concomitant signal of the MJO's propagation, no tropical cyclone was formed (with initial day of April 10). The results suggest that the representation of northward migration of convection and MJO phase are important for capturing tropical cyclogenesis in the Bay of Bengal and that the enhanced predictability of the MJO and the monsoon onset would be a key factor for the improved prediction of tropical cyclone. The other simulations with NICAM also suggest that intra-seasonal disturbance such as MJO is crucial for formation of tropical cyclone over the basins around the western Pacific warm pool - across the Indian Ocean to the western Pacific (Miura et al. 2007;Fudeyasu et al. 2008;Yanase et al. 2010), sometimes with the combination of large-scale processes such as a likelihood of tropical upper-tropospheric trough (Oouchi et al. 2009). For example, Oouchi et al. (2009) reported an successful simulation of an MJO-associated cyclogenesis about 3 weeks after the start of the time integration. The importance of MJO in prediction of tropical cyclone has also been intensely investigated in ECMWF (Vitart 2009).
Future projection
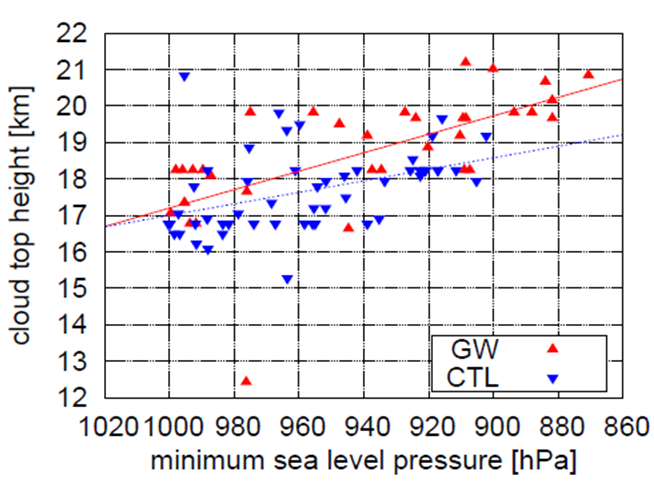
Computationally demanding GCRM is still not sufficient to perform many months and years of time integration that can derive statistically robust future projection of tropical cyclone. Yet, we would come up with a solution and new collaboration with the traditional AGCM research with the advent of powerful computational resources. A first challenge of GCRM to give an insight into future change of tropical cyclone was reported by Yamada et al. (2010) from a suite of 14-km mesh time-slice experiments with NICAM. They discussed possible change in the cloud height of tropical cyclones as well as the general statistics of frequency, intensity, and environmental factors for TCs. A highlight of the study is on the projection of the change in the cloud height of TC (Fig.8). It was found that the cloud height becomes taller for more intense TCs and that this relationship is strengthened with a global-warming condition. This is the type of the problem that was unable to be developed by traditional hydrostatic models, and points to an attractive direction of research with GCRM. An extension of this type of future projection research with GCRM will be not only appealing on its own right, but important to help mitigate the uncertainties in the traditional GCM in projecting future change of tropical cyclone.
Figure 6. Temporal evolution of the observed (re-analysis) field of zonally averaged zonal wind (m/s) at 850 hPa (JMA/JCDAS) over 80E-100E (a), blended zonally averaged infrared (IR) brightness temperature (NCEP/CPC 4 km Global IR datasets) shown by the white-navy blue scale (K) over 80E-100E, and zonally averaged surface precipitation rate (mm/h) (Global Rainfall Map derived from the JAXA/EORC GSMaP Near Real-Time System, ver. 1.0) shown by the color scale for values greater than 0.3 (mm/h) over 80E-100E (b) during the period from April 1 to May 31, 2008. Simulated zonally averaged zonal wind (m/s) at 850 hPa over 80E-100E (c, e, g) and simulated zonally averaged outgoing long wave radiation (OLR) (W/m2) shown by the white-navy blue scale and surface precipitation rate (mm/h) shown by the rainbow color scale for values grater than 0.3 (mm/h) over 80E-100E (d, f, h). Panels (c)-(d), (e)-(f), and (g)-(h) show the results of simulations with initial days of April 10, April 23, and April 24, 2008, respectively. The weather symbol and double solid circles in each figure show the observed and simulated position and day of the genesis of cyclone Nargis, respectively. |
Figure 7. Temporal-spatial evolution of initial disturbances
and tropical depressions from 1200 UTC on April 24-April 27. Blended sea surface
winds at 10 m are shown by vectors (m/s) and infrared (IR) brightness temperature
is shown by the color scale (K, observations) and OLR (W/m2, simulations). Left
column shows observed (re-analysis) fields obtained by JMA/JCDAS (wind) and
NCEP/CPC 4 km Global IR datasets. Right column shows the one of the results of
NICAM simulations (initial day of April 23 case). Observed and simulated times
are shown above each figure. The color scale differs between observed and
simulated data. The 1st, 2nd, 3rd, and 4th rows (from the upper) show the case
of 12:00 UTC on April 24-April 27, respectively. |

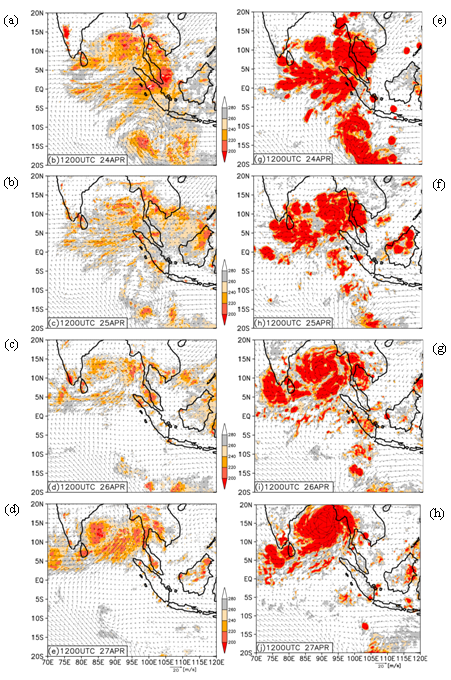
Figure 8. Scatter plots for the cloud top height and the MSP for the simulated TCs. CTL (blue inverted triangle) and GW (red triangle). The regression line for CTL (blue broken line) and GW (red solid line) is f(x) = 32.8-0.0158x, and g(x) = 42.5-0.0253x, respectively, where x denotes MSP [hPa]. The cloud height is defined as the highest altitude below which the sum of the solid hydrometeors (snow, cloud ice, and water contents) exceeds 1.0x10.5 kg/kg at least for 30 grid points in 10x10degree box. |
|
NASA GEOS-5 Global High-Resolution Hurricane Simulations
Current NWP is at the limit of hydrostatic models, with resolutions of 10- to 20-km. Results from a global non-hydrostatic version of the NASA Goddard Earth Observing System global atmospheric model version 5 (GEOS-5) hint at the potential for improved numerical weather prediction skill as we advance to non-hydrostatic models at resolutions finer than 14-km. The main benefits will likely be in the tropics, with better predictions of the genesis stages of tropical cyclones and of the internal structure of their mature stages. Inter-seasonal variability of tropical cyclone activity in terms of both frequency and intensity can now be explored with a high-resolution global climate model.Hurricane Bill 2009
10-day NWP experiments at 3.5-, 7-, and 28-km initialized 16-Aug-2009 at 21z from a 50-km GEOS-5 analysis develop tropical storm Bill to a category 4 hurricane before weakening by the end of the forecast period (Movie 1). Comparing OLR from 28- and 3.5-km GEOS-5 forecasts with 4-km global-merged IR brightness temperature data, show the improved organization of convection throughout the tropics and within the circulation of hurricane Bill as resolution increases (Figure 9).
-
Movie 1a: Outgoing longwave radiation simulated at 3.5-km globally with
GEOS-5 from August 17-21 depicting the intensification of the 2009
Atlantic Hurricane Bill
-
Movie 1b: Moisture and wind speeds simulated at 3.5-km globally with
GEOS-5 from August 17-21 depicting the intensification of the 2009
Atlantic Hurricane Bill
Figure 9. Composite GOES infrared satellite imagery (bottom), OLR from GEOS-5 at 3.5-km (middle) and 28-km (top) as seen on 20-August-2009 at 18z, 69 hours into the 15-day forecasts with GEOS-5.. |
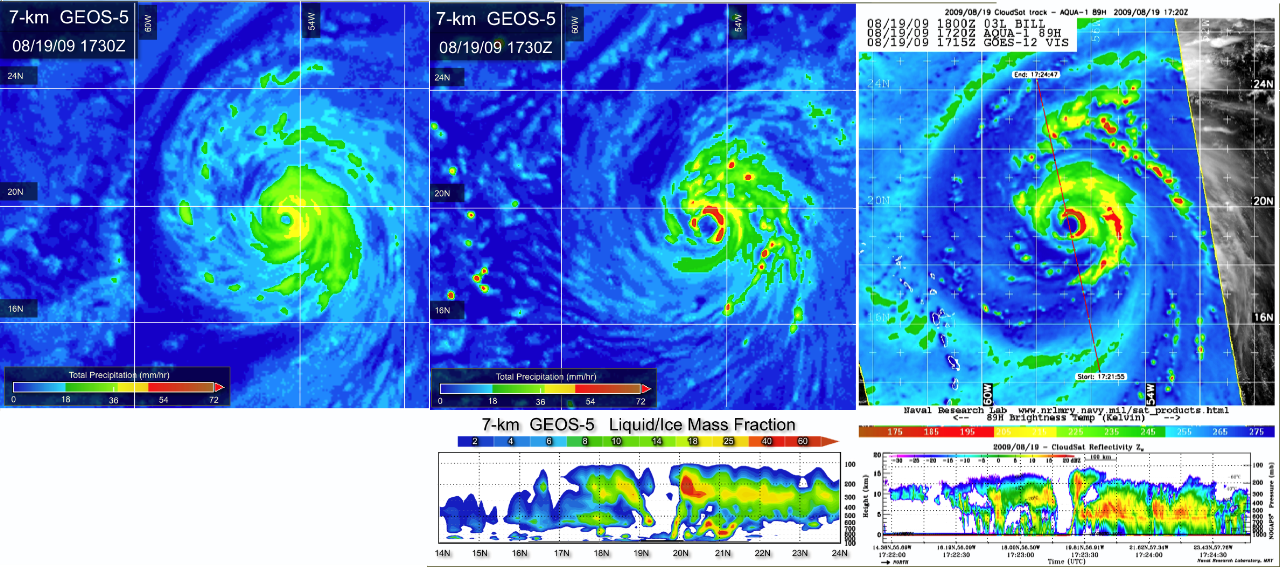
Figure 10. NASA's satellite CloudSat captured an eye overpass of category 4 Hurricane Bill on 19-August-2009 at 17:20z (bottom-right), the 89 GHz AMSR-E instrument onboard the Aqua spacecraft (top-right) reveals deep convection and low brightness temperatures ( < -117 F) as shown by the bright red and deep brown colors (Image Credits: NASA/JPL/The Cooperative Institute for Research in the Atmosphere (CIRA), Colorado State University). Precipitation intensities from GEOS-5 at 7-km with the full influence of the RAS convection scheme (top-left) produces reduced convection and a compact drizzle filled eye. Precipitation rates from GEOS-5 at 7-km (top-center) with the reduced influence of RAS by the Tokioka limiter mirror the horizontal structure of deep convection as observed by the AMSR-E instrument, while a vertical cross-section of liquid and ice fractions from GEOS-5 (bottom-center) depicts the well defined eye-wall and deep thunderstorms in the surrounding convection. |

Nature Runs
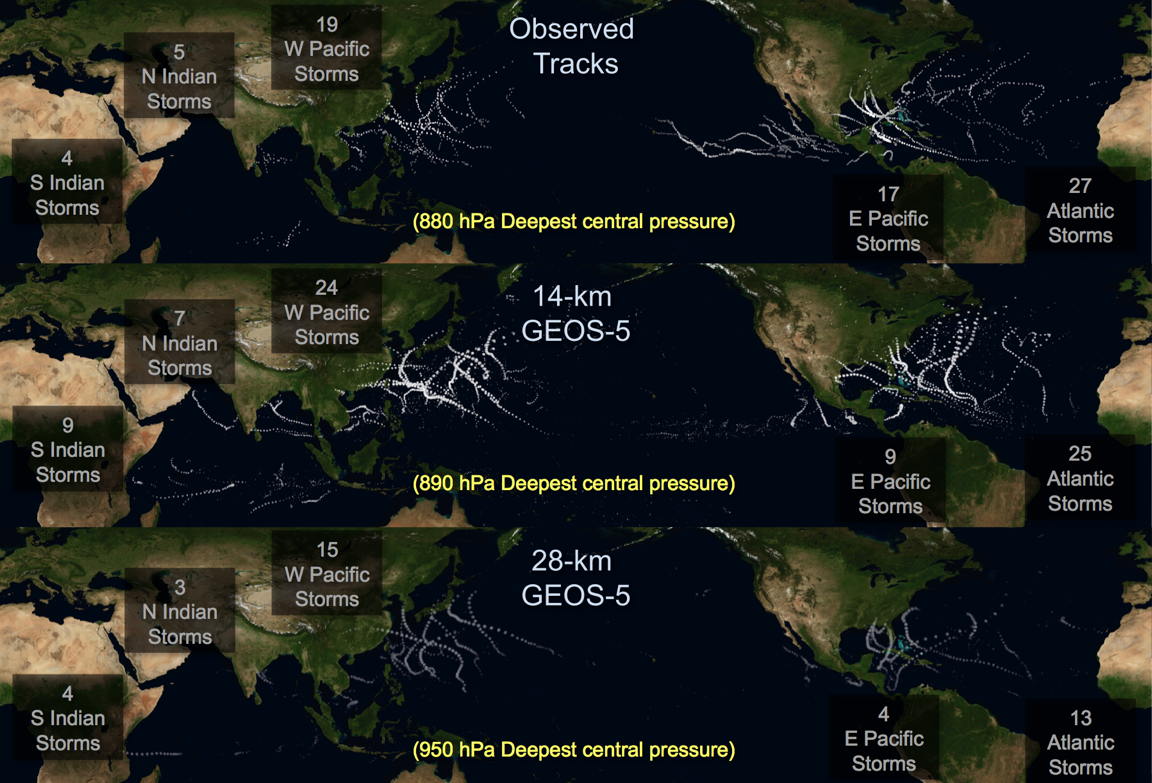
Building on the improved representation of convection and tropical cyclone structure, GEOS-5 has been used to prepare "Nature Runs" at 14-km globally. These AMIP-style "Nature Runs" are free running global simulations initialized from 50-km analyses and forced only by observed sea surface temperatures and climatological aerosol emissions (Movie 2). GEOS-5 demonstrates a capability to predict realistic occurrences of tropical cyclone activity in terms of frequency and track location in all basins (Figure 11). The 2005 Atlantic basin activity reflects the unusually high number of storms for the period from May-Dec, as GEOS-5 simulates 25 storms compared with the 27 observed.
Figure 11. Global tropical cyclone tracks from May through December 2005 as observed (top), and simulated in nature runs with GEOS-5 at 14-km (middle) and 28-km (bottom). Counts of total tropical cyclones for each basin are presented along with the minimum value of observed/modeled sea level pressure over all storms. |
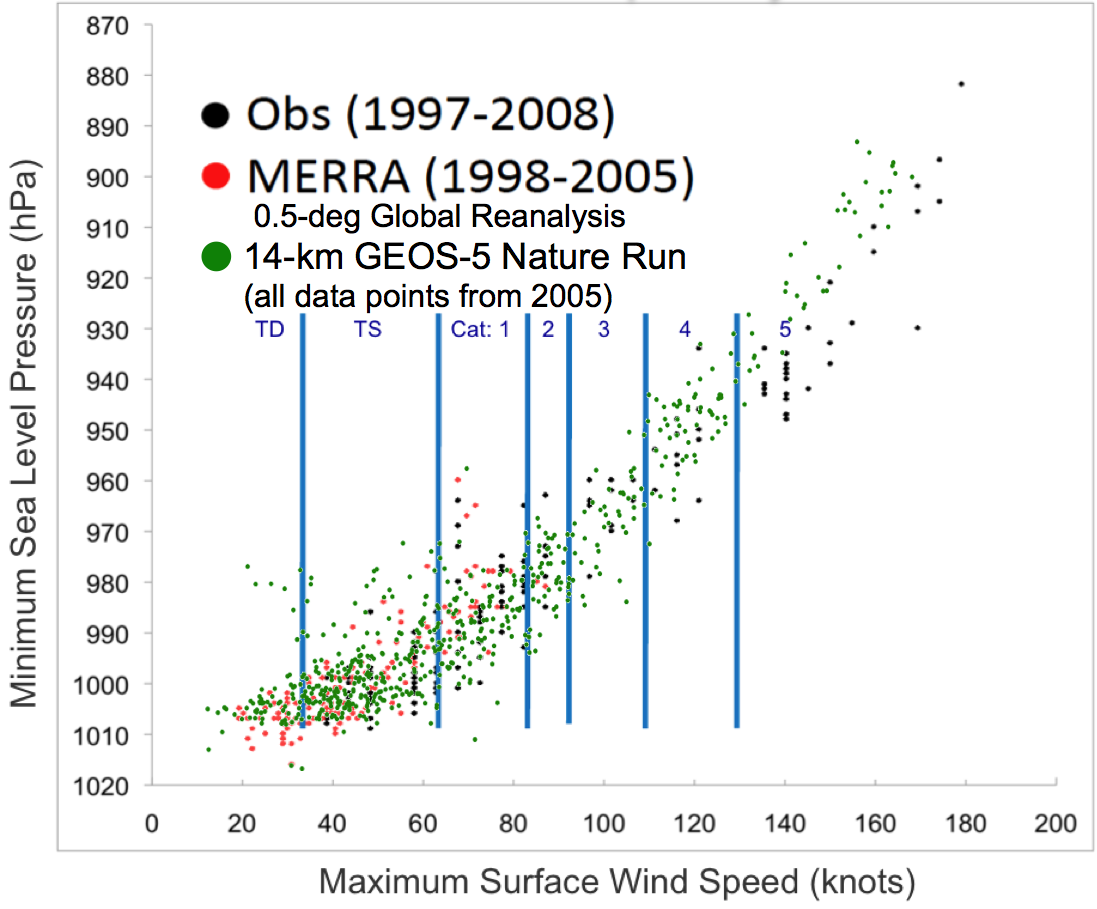
Figure 12. Minimum sea level pressure and maximum near surface winds as observed in all Atlantic tropical cyclones from 1997-2008 (black circles), for all Atlantic tropical cyclones from MERRA (a 50-km re-analysis using GEOS-5 from 1998-2005, red circles), and for all 3-hourly observed Atlantic tropical cyclones from a 14-km nature run with GEOS-5 (green circles). |
References
- Bender, M., T. Knutson, R. Tuleya, J. sirutis, G. Vecchi, S.T.Garner and I. Held, 2010: Modeled impact of anthropogenic warming on the frequency of intense Atlantic hurricanes. Science 327, 454–458.
- Bengtsson, L., K. Hodges and M. Esch, 2007a: Tropical cyclones in a T159 resolution global climate model: comparison with observations and re-analyses. Tellus, 59A, 396–416.
- Bengtsson, L., K. Hodges, M. Esch, N. Keenlyside, L. Kornblueh, J.-J. Luo, and T. Yamagata, 2007b: How may tropical cyclones change in a warmer climate. Tellus, 59A, 539–561.
- Chauvin, F., J.-F. Royer, and M. Deque, 2006: Response of hurricane-type vortices to global warming as simulated by ARPEGE-climat at high resolution. Clim. Dyn., 27, 377–399.
- Copsey, D., R. Sutton, and J. Knight, 2006: Recent trends in sea level pressure in the indian ocean region. Geophys. Res. Let., 33, L19, 712, doi:10.1029/2006GL027, 175.
- Douville, H., 2005: Limitations of time-slice experiments for predicting regional climate change over South Asia. Climate Dynamics, 24, 373–391.
- Emanuel, K., R. Sundararajan, and J. Williams, 2008: Hurricanes and global warming: results from downscaling IPCC AR4 simulations. Bull. Amer. Meteor. Soc., 347–367.
- Fudeyasu, H, Y. Wang, M. Satoh, T. Nasuno, H. Miura, W. Yanase, 2008:The global cloud-system-resolving model NICAM successfully simulated the lifecycles of two real tropical cyclones. Geophys. Res. Lett. 35: L22808, doi:10.1029/2008GL0360033
- Gualdi, S., E. Scoccimarro, A. Navarra, 2008:
Changes in Tropical Cyclone Activity due to Global Warming: Results
from a High-Resolution Coupled General Circulation
Model. J. of Clim., 21, 5204–5228.
- Held, I. M. and M. Zhao, 2011: The response of tropical cyclone statistics to an increase in CO2 with fixed sea surface temperatures. J. Climate, in press.
- Kikuchi, K, and B. Wang, 2010: Formation of tropical cyclones in the Northern Indian Ocean associated with two types of tropical intraseasonal oscillation modes. J.Meteor.Soc.Japan,88,475–496.
- Knutson, T., J. Sirutis, S. Garner, G. Vecchi, and I. Held, 2008: Simulated reduction in Atlantic hurricane frequency under twenty-first-century warming condition. Nature Geoscience, doi:10.1038/ngeo202.
- Knutson, T., et al., 2010: Tropical cyclones and climate change. Nature Geoscience, doi:10.1038/ngeo0779.
- LaRow, T., Y.-K. Lim, D. Shin, E. Chassignet, and S. Cocke, 2008: Atlantic basin seasonal hurricane simulations. J. Climate, 21, 3191–3206.
- Li, T., M. Kwon, M. Zhao, J.-S. Kug, J.-J. Luo, and W. Yu, 2010: Global warming shifts Pacific tropical cyclone location. Geophys. Res. Let., 37, L21, 804, doi:10.1029/2010GL045,124.
- McDonald, R., D. Bleaken, D. Creswell, V. Pope, and C. Senior, 2005: Tropical storms: representation and diagnosis in climate models and the impact of climate change. Clim. Dyn., 25, 19–36.
- Miura, H, M. Satoh, T. Nasuno, A.T. Noda, and K. Oouchi, 2007: An Madden-Julian Oscillation event simulated using a global cloud-resolving model. Science, 318,1763–1765.
- Moorthi, S, and M. J. Suarez, 1992: Relaxed Arakawa-Schubert: A parameterization of moist convection for general circulation models. Mon. Wea. Rev., 120, 978–1002.
- Oouchi, K., J. Yoshimura, H. Yoshimura, R. Mizuta, S. Kusunoki, and A. Noda, 2006: Tropical cyclone climatology in a global-warming climate as simulated in a 20 km mesh global atmospheric model: Frequency and wind intensity. J. Meteor. Soc. Japan, 84, 259–276.
- Oouchi, K., A.T. Noda, M. Satoh, H. Miura, H. Tomita. T. Nasuno, and S. Iga, 2009: A simulated preconditioning of typhoon genesis controlled by a boreal summer Madden-Julian Oscillation event in a global cloud-system-resolving model. SOLA, 5, 065–068, doi:10.2151/sola.2009-017.
- Rayner, R., D. Parker, E. Horton, C. Folland, L. Alexander, and D. Rowel, 2003: Global analyses of sea surface temperature, sea ice, and night marine air temperature since the late nineteenth century. J. Geophys. Res., 108, D14,4407,doi:10.1029/2002JD002,670.
- Reynolds, R., N. Rayner, T. Smith, D. Stokes and W. Wang, 2002: An improved in situ and satellite SST analysis for climate. J. Climate, 15, 1609–1625.
- Satoh, M, T. Matsuno H, Tomita, H, Miura, T. Nasuno and S. Iga S, 2008: Nonhydrostatic Icosahedral Atmospheric Model (NICAM) for global cloud resolving simulations. J. Comput. Phys. 227: 3486–3514, doi:10.1016/j.jcp.2007.02.006
- Sugi, M., A. Noda, and N. Sato, 2002: Influence of the global warming on tropical cyclone climatology: An experiment with the JMA global model. J. Meteor. Soc. Japan, 80, 249–272.
- Sugi, M., H. Murakami, and J. Yoshimura, 2009: A reduction in global tropical cyclone frequency due to global warming. SOLA, 5, 164–167.
- Taniguchi, H., W. Yanase, and M. Satoh, 2010: Ensemble simulation of cyclone Nargis by a global cloud-system-resolving model - modulation of cyclogenesis by the Madden-Julian Oscillation. J. Meteor. Soc. Japan,88, 571–591.
- Tomita, H. and M. Satoh, 2004: A new dynamical framework of nonhydrostatic global model using the icosahedral grid. Fluid Dyn. Res.,34, 357–400.
- Vecchi, G. and B. Soden, 2007: Effect of remote sea surface temperature change on tropical cyclone potential intensity. Nature, 450, 1066–1071 doi:10.1038 Nature, 423.
- Vecchi, G., B. Soden, A. Wittenberg, I. Held, A. Leetmaa, and M. harrison, 2006: Weakening of tropical pacific atmospheric circulation due to anthropogenic forcing. Nature, 441, 73–76.
- Vecchi, G., K. Swanson, and B. Soden, 2008: Whither hurricane activity? Science, 322, 687–689.
- Villarini, G., G. Vecchi, T. Knutson, M. Zhao, and J. Smith, 2011: North Atlantic tropical storm frequency response to anthropogenic forcing: projections and sources of uncertainty. J. Climate, in press.
- Vitart, F, 2009: Impact of the Madden Julian Oscillation on tropical storms and risk of landfall in the ECMWF forecast system. Geophys. Res. Lett. ,36: L15802, doi:10.1029/2009GL039089.
- Yamada, Y, K. Oouchi, M. Satoh, H. Tomita, and W. Yanase, 2010: Projection of changes in tropical cyclone activity and cloud height due to greenhouse warming: global cloud-system-resolving approach. Geophys. Res. Lett., 37, L07709, doi:10.1029/2010GL042518. -- "Research Highlights" in Nature, Apr 22 (2010) doi:10.1038/4641107c, Climate change: Fewer, taller, fiercer, Nature, 464, 1107.
- Yanase, W, H. Taniguchi, and M. Satoh M, 2010: Environmental modulation and numerical predictability associated with the genesis of tropical cyclone Nargis (2008). J. Meteor. Soc. Japan,88, 497–519.
- Yoshimura, J. and M. Sugi, 2005: Tropical cyclone climatology in a high-resolution AGCM - Impacts of SST warming and CO2 increase. SOLA, 1, 133–136, doi:10.2151.
- Zhao, M., I. M. Held, S.-J. Lin, and G. A. Vecchi, 2009: Simulations of global hurricane climatology, interannual variability, and response to global warming using a 50km resolution gcm. J. Climate, 22, 6653–6678.
- Zhao, M., I.M. Held and G.A. Vecchi, 2010: Retrospective forecasts of the hurricane season using a global atmospheric model assuming persistence of SST anomalies. Mon. Wea. Rev., 138, 3858–3868.
- Zhao, M. and I.M. Held, 2010: An analysis of the effect of global warming on the intensity of Atlantic hurricanes using a GCM with statistical refinement. J. Climate, 23, 6382–6393.
- Zhao, M. and I. M. Held, 2011: TC-permitting GCM simulations of hurricane frequency response to sea surface temperature anomalies projected for the late 21st century. J. Climate, in press.
- Zhao, M., I. M. Held and S-J Lin, 2011: Some counter-intuitive dependencies of tropical cyclone frequency on parameters in a GCM. J. Atmos. Sci., submitted.